New Maps Show Flood Risk for Iowa Farmland
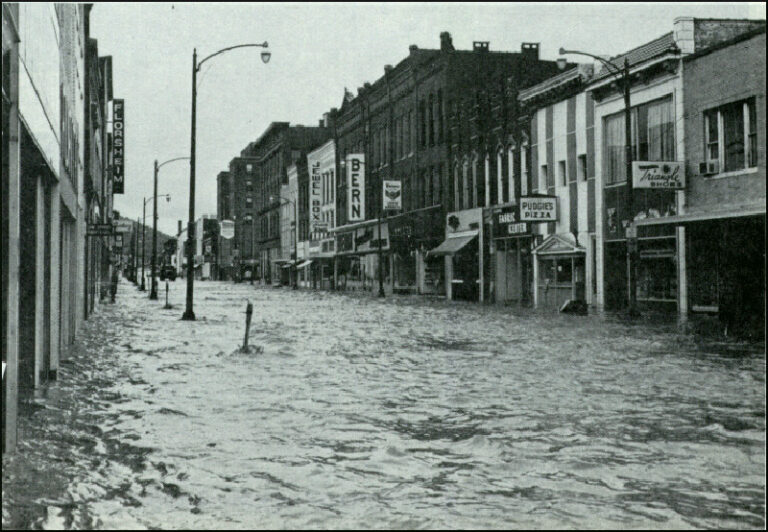
Iowa has seen its fair share of flooding. Since 1953, 29 flood-related disaster declarations have been issued for the state. Major, if not historic, flooding has occurred four times during the past 14 years alone — in 2008, 2014, 2016, and 2019.
A new comprehensive agricultural flood risk assessment shows which of Iowa’s farmlands are most at risk for floods. The study, conducted by the IIHR–Hydroscience and Engineering at the University of Iowa, is the first of its kind to detail the flood risk to farmland statewide. Using flood maps developed at the Iowa Flood Center, and incorporating data from the Federal Emergency Management Agency (FEMA) and the U.S. Department of Agriculture to create the crop flood-risk analysis, researchers were able to provide insights into the flood vulnerability of a state where agricultural practice is one of the core driving economic factors. The study also emphasizes the importance of future mitigation assessments to ensure food security, protect jobs, and reduce potential flooding impacts for the state’s urban regions, and also emphasizes the importance of the downstream impacts of possible mitigation efforts.
Among the main findings:
- Nearly 450,000 acres of Iowa farmland are located in a two-year flood return period, meaning there’s a 50% chance the land will flood in a given year. That’s less than 2% of the total farmable land analyzed in the study.
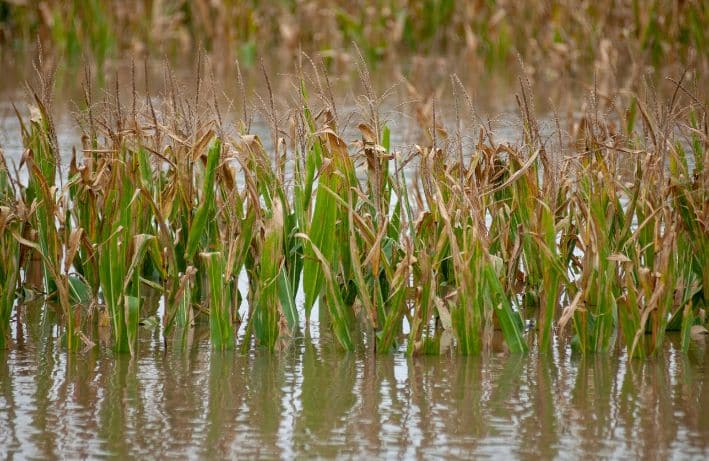
- Iowa agriculture sees crop losses, on average, of $230 million a year due to farming that takes place in flood-prone areas.
The researchers also identified four watersheds as most vulnerable to flooding and crop losses: Middle Cedar in east-central Iowa, North Raccoon and South Skunk in central Iowa, and West Nishnabotna in southwest Iowa.
The new agricultural flood-risk maps developed by the IIHR researchers can be updated to reflect changes in climate; changes in land use, such as a shift in farming in a location; and changes to the landscape, such as the addition of a road or other infrastructure, to give a continuous picture of the flood potential for farmland across the state.
“It’s a comprehensive approach to help create solutions with information that helps farmers take a clear-eyed look at their land and for policymakers and others to use as a starting point to determine how Iowa’s landscape can be best used to reduce flooding,” says Enes Yildirim, graduate research assistant at IIHR and the study’s corresponding author.
The researchers analyzed nearly 25 million acres of agricultural land in Iowa and farming operations from 2016 to 2020 to classify the flood risk according to eight scenarios: 2-year, 5-year, 10-year, 25-year, 50-year, 100-year, 200-year, and 500-year return periods. Cropland located in a 2-year return period has a 50% chance of flooding in a given year; farmland in a 5-year return period has a 20% of flooding in a given year; while farmland in a 100-year return period has a 1% chance of flooding in a given year.
The researchers then incorporated flood maps from FEMA and the U.S. Army Corps of Engineers along with data from the USDA, including crop type, yields, costs and price, planting frequency, and a corn suitability rating, which indexes a farmland’s productivity.
The new maps seek to address objectively the flood stress points by showing farmland that is prone to chronic flooding and has low productivity yields compared to other areas. The University of Iowa and the Iowa Water Center funded the research.

The study, “Agricultural flood vulnerability assessment and risk quantification in Iowa,” was published online Feb. 26 in the journal Science of the Total Environment.