Fifth National Climate Assessment Shows Far-Reaching Impacts of Climate Change
A new national report finds that the impacts of weather extremes — exacerbated by climate change — are far-reaching across every region of the United States. One of the most direct ways that Americans experience climate change is through increases in the frequency and intensity of extreme weather events. So far this year, the United States has already experienced 25 weather and climate disasters that each resulted in more than a billion dollars of damages, costing hundreds of lives and more than $73 billion total.
The Fifth National Climate Assessment (NCA5), released Nov. 14, documents observed and projected vulnerabilities, risks, and impacts associated with climate change across the United States and provides examples of actions underway in many communities.
The report, a collaboration between more than a dozen federal agencies and a wide array of academic researchers, takes stock of just how severe global warming has become and meticulously breaks down its effects by geography — 10 distinct regions in total, encompassing all of the country’s states and territories. The Congressionally mandated report is released roughly every five years.
Weather disasters that hit the United States a few times a year in the 1980s now inflict billions of dollars in damage every few weeks on average. Hurricane Ian alone caused $113 billion in damage in Florida last year. Still, communities across the country are doing more to adapt to climate disasters. Pittsburgh, for example, has required new development projects to account for increasingly heavy rainfall.
“The takeaway from this assessment, the takeaway from all of our collective work on climate, should not be doom and despair,” White House national climate adviser Ali Zaidi said on a call with reporters. “The takeaway … should be a sense of hope and possibilities.”
Compared to previous iterations, the NCA5 report gives greater emphasis to the importance of Indigenous knowledge in understanding long-range change in our environment and its impacts, as well as environmental justice to understand the unequal impacts of climate change and to creating equitable solutions.
Also new for this report is an interactive online NCA5 Atlas, which allows users to explore the latest localized temperature and precipitation projections. The atlas is designed to be used by national, state, tribal and community leaders, adaptation planners, researchers, educators and the general public.
To access the full report and find other background information, please visit the USGCRP website.
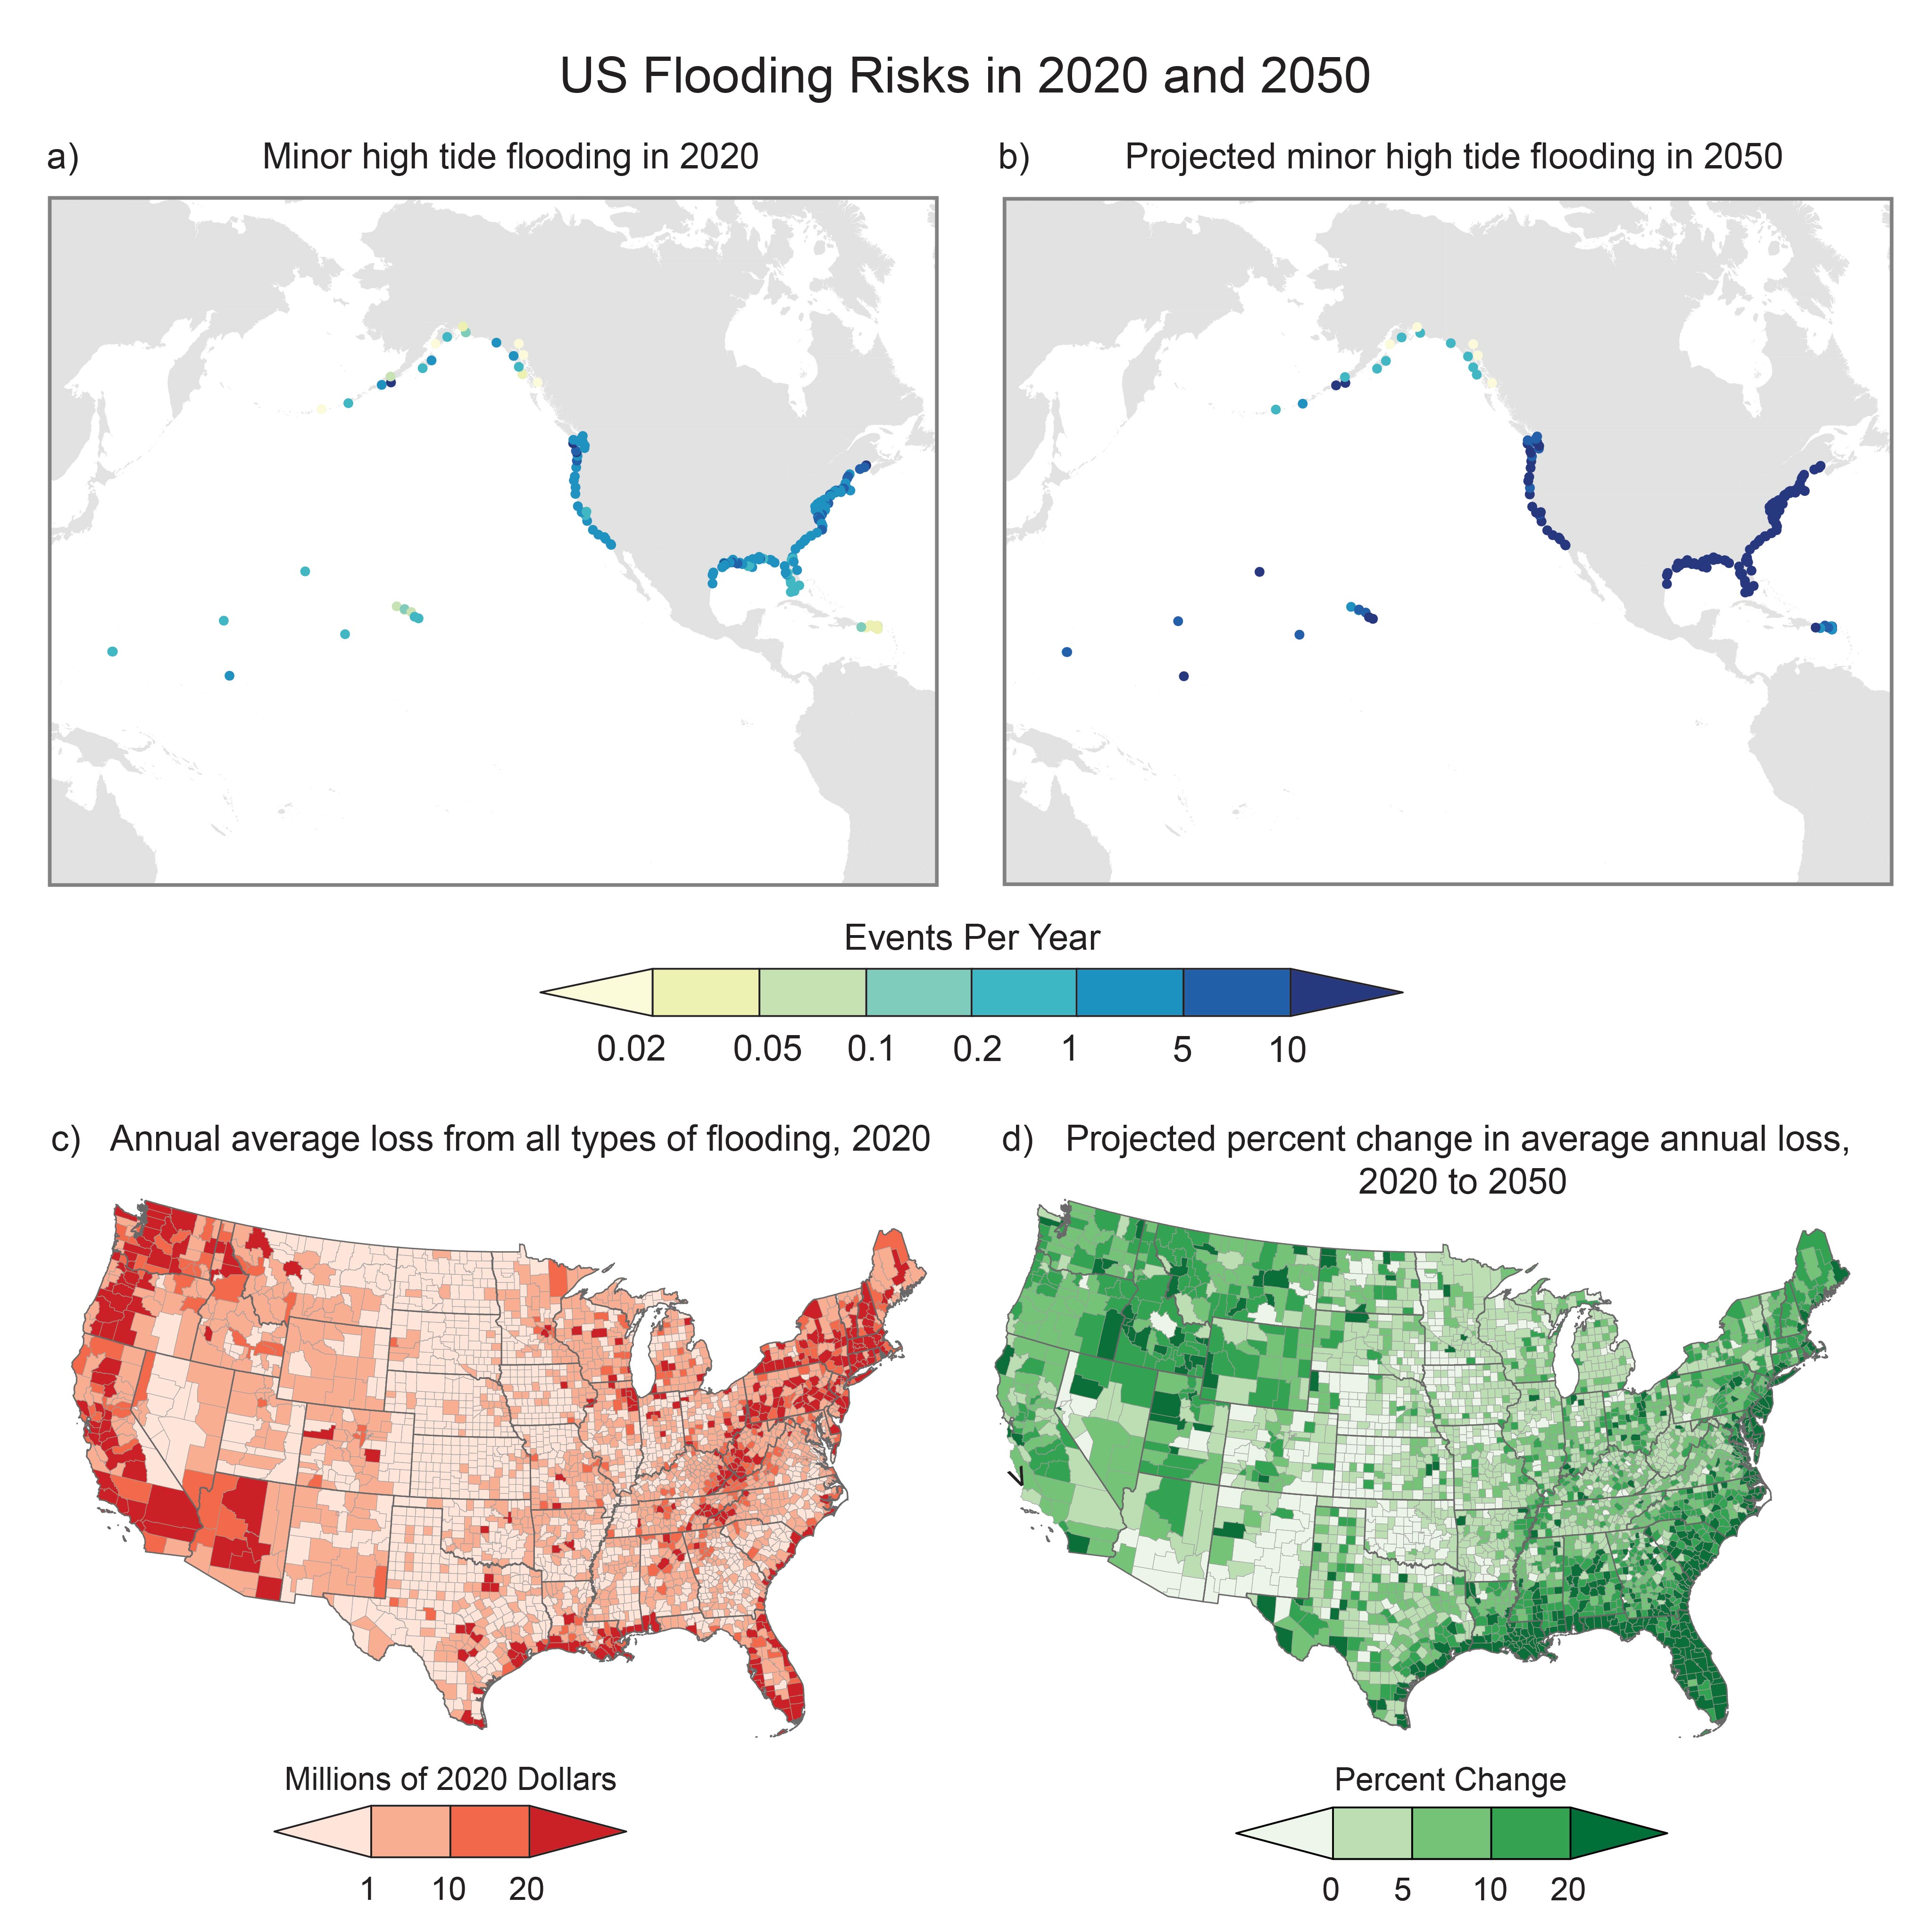
Increasing flooding puts more people and assets at risk. FIGURE 1.10. (top row) Maps show (a) the average number of minor high tide flooding events per year in 2020 (with historical sea level rise) and (b) the expected number of events per year in 2050 (when driven by extrapolated sea level rise). (bottom row) Maps show (c) average annual loss (AAL) from all types of flooding in millions of dollars in 2020 and (d) the projected changes in AAL in 2050 relative to 2020. AAL estimates were made only for the contiguous US. Over the next three decades, the number of flooding days along all coastlines of the US is expected to increase. These increases in the occurrence of flooding will drive greater AALs, especially in coastal areas of the US. (a, b) Adapted from Sweet et al. 2022; (c, d) adapted from Wing et al. 2022 [CC BY 4.0].
Fifth National Climate Assessment Webinar Series
The U.S. Global Change Research Program (USGCRP) is hosting a series of webinars dedicated to the Fifth National Climate Assessment. Please join to learn more about each chapter, ask questions, and hear directly from the chapter authors.
December 5: Forests
December 6: Southeast
December 6: Southern Great Plains
December 7: Energy
January 9: Northwest
January 10: Earth System Processes
January 11: Mitigation
January 12: Ecosystems
January 17: Alaska
January 18: Agriculture, Rural Communities, and Food Systems
January 19: Tribes and Indigenous Peoples
January 22: Coastal Effects and Blue Carbon
January 23: Oceans
January 26: Complex Systems and Compound Extreme Events
February 12: Social Systems and Justice
February 13: Hawaii and US-Affiliated Pacific Islands
February 14: Human Health and COVID-19
February 15: Adaptation
February 16: International
February 20: Midwest
February 21: Transportation
February 22: Northeast
February 23: Southwest and Western Wildfire
February 27: Northern Great Plains
February 28: Air Quality
March 4: Economics and Supply Chains
March 12: Indicators
March 15: Land Cover and Land Use Change