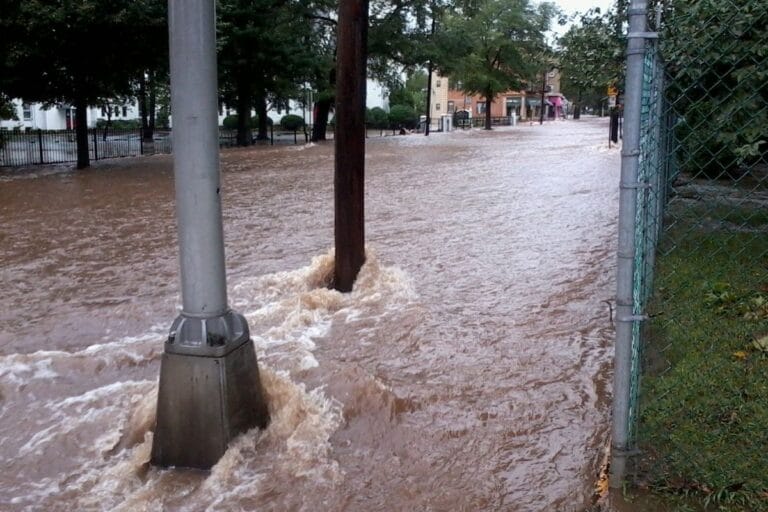
FEMA Halts Rule That Protects Against Future Floods
The Trump administration has ordered FEMA staff to immediately halt implementation of the Federal Flood Risk Management Standard (FFRMS), dealing a serious blow to the nation’s ability to protect its citizens and taxpayer-funded infrastructure from future flood disasters. To implement the FFRMS, FEMA issued a final rule legally obligating the agency to ensure all FEMA-funded construction projects were higher elevated and better strengthened against climate-related flood impacts, like sea-level rise.
“Ignoring reality doesn’t make it go away. Rebuilding hospitals, highways and sewage plants in the path of floods puts people in danger when the next storm hits and means the federal government will be back, paying to rebuild this infrastructure again and again,” said Rob Moore, director of flooding solutions at NRDC (Natural Resources Defense Council). “We already know what the cycle of flood-rebuild-repeat looks like. This means that billions of dollars in disaster aid will be wasted and people will be put in harm’s way.”
The flood protection standard ensures that public buildings, bridges and roads, public utilities, and other infrastructure that are damaged in a flood are sited and rebuilt so they are less vulnerable to future flood damages. The standard requires that facilities be rebuilt with an additional margin of safety for flooding and, in coastal areas, that projects be sited and designed with future sea level rise in mind.
Between 2015 and 2024 FEMA spent more than $60 billion to rebuild public buildings and infrastructure in the aftermath of flood disasters, the majority of which were built to local or state codes that proved inadequate and do not take into account future flood risks or sea level rise. This includes:
- $9.9 billion for roads and bridges
- $1.1 billion for levees, seawalls, and other water management infrastructure
- $27.3 billion for utilities, including water and sewer plants
- 19.1 billion for public buildings, including publicly owned affordable housing units
- $3.0 billion for parks and other facilities
Failing to implement this standard means the federal government will continue to throw good money after bad, rebuilding public buildings and infrastructure to a less protective design standard that a recent disaster has already demonstrated to be inadequate.
“The Trump administration will squander billions in taxpayer dollars to rebuild things that are very likely to be washed away again — not to mention knowingly putting people in harm’s way,” said Chad Berginnis, executive director of the Association of State Floodplain Managers.
FEMA is not the only agency likely impacted. President Trump revoked the executive order establishing the flood protection standard upon assuming office in January. This is the second time he’s revoked this standard, undermining federal efforts to make the nation more prepared for rising seas and flood risks.
###
BACKGROUND MATERIAL
The FFRMS was developed because it is no longer safe or adequate to build for the flood risks of the past. More extreme rainfall and rising seas are exacerbating flood risk across the nation. FEMA already spends billions of dollars per year helping communities rebuild flood damaged infrastructure, but is not built to FFRMS standards. Since 2015, the federal government, through FEMA, has spent $60 billion to rebuild flood-damaged public buildings, roads, and water and electric utilities to standards that are less safe than FFRMS standards. As climate change exacerbates flooding, federal taxpayers will increasingly be on the hook for post-flood recovery.
Public Assistance for 2020-2024 Flood-Related Disasters* (millions)
Categories C through G only. Incident types: coastal storm, dam/levee break, flood, hurricane, severe storm(s), tropical storm, tsunami, typhoon.
| Funding Category | 2020 | 2021 | 2022 | 2023 | 2024 | Total |
| Roads & Bridges | $238 | $438 | $1,176 | $246 | $180 | $2,278 |
| Water | $80 | $75 | $80 | $26 | $2 | $262 |
| Buildings & Equipment | $1,290 | $760 | $150 | $260 | $7 | $2,467 |
| Utilities | $1,744 | $613 | $251 | $250 | $37 | $2,894 |
| Parks & Other | $190 | $176 | $184 | $52 | $10 | $611 |
| Total | $3,541 | $2,062 | $1,841 | $833 | $235 | $8,512 |
Public Assistance for 2015-2019 Flood-Related Disasters (millions)
Categories C through G only. Incident types: coastal storm, dam/levee break, flood, hurricane, severe storm(s), tropical storm, tsunami, typhoon.
| Funding Category | 2015 | 2016 | 2017 | 2018 | 2019 | Total |
| Roads & Bridges | $143 | $163 | $5,912 | $723 | $690 | $7,632 |
| Water | $3 | $24 | $528 | $64 | $178 | $797 |
| Buildings & Equipment | $16 | $318 | $15,616 | $530 | $155 | $16,634 |
| Utilities | $64 | $90 | $23,089 | $533 | $496 | $24,272 |
| Parks & Other | $9 | $43 | $1,864 | $248 | $189 | $2,353 |
| Total | $235 | $639 | $47,008 | $2,097 | $1,708 | $51,688 |
Top 10 States: Public Assistance for 2015-2024 Flood-Related Disasters
Categories C through G only. Incident types: coastal storm, dam/levee break, flood, hurricane, severe storm(s), tropical storm, tsunami, typhoon. Excludes U.S. territories.
| Rank | State | Total (Categories C through G) |
| 1 | Louisiana | $2,347,925,741 |
| 2 | Florida | $1,571,025,274 |
| 3 | Texas | $1,461,760,357 |
| 4 | New York | $1,028,962,939 |
| 5 | North Carolina | $568,385,138 |
| 6 | Nebraska | $501,783,865 |
| 7 | West Virginia | $485,231,541 |
| 8 | Kentucky | $471,693,081 |
| 9 | Tennessee | $277,352,353 |
| 10 | Missouri | $263,108,762 |
Top 10 Counties: Public Assistance for 2015-2024 Flood-Related Disasters
Categories C through G only. Incident types: coastal storm, dam/levee break, flood, hurricane, severe storm(s), tropical storm, tsunami, typhoon. Excludes U.S. territories.
| Rank | County | Total (Categories C through G) |
| 1 | Harris County, TX | $715,464,732 |
| 2 | Nassau County, NY | $670,324,006 |
| 3 | Calcasieu Parish, LA | $537,490,988 |
| 4 | Jefferson Davis Parish, LA | $535,455,270 |
| 5 | Terrebonne Parish, LA | $411,615,036 |
| 6 | Kanawha County, WV | $345,327,860 |
| 7 | Bay County, FL | $311,462,650 |
| 8 | East Baton Rouge Parish, LA | $298,702,324 |
| 9 | Wake County, NC | $219,113,818 |
| 10 | Franklin County, KY | $169,542,787 |